
Beyond ETFs Pro – The App
 The user experience of Beyond ETFs is designed for the retail investor and offers Zone Changes, personalized Scorecard and unmasked ticker, exclusively for subscribers. Users can operate the app in landscape or portrait orientations. Initially, the app is available only for iPhone and iPad.
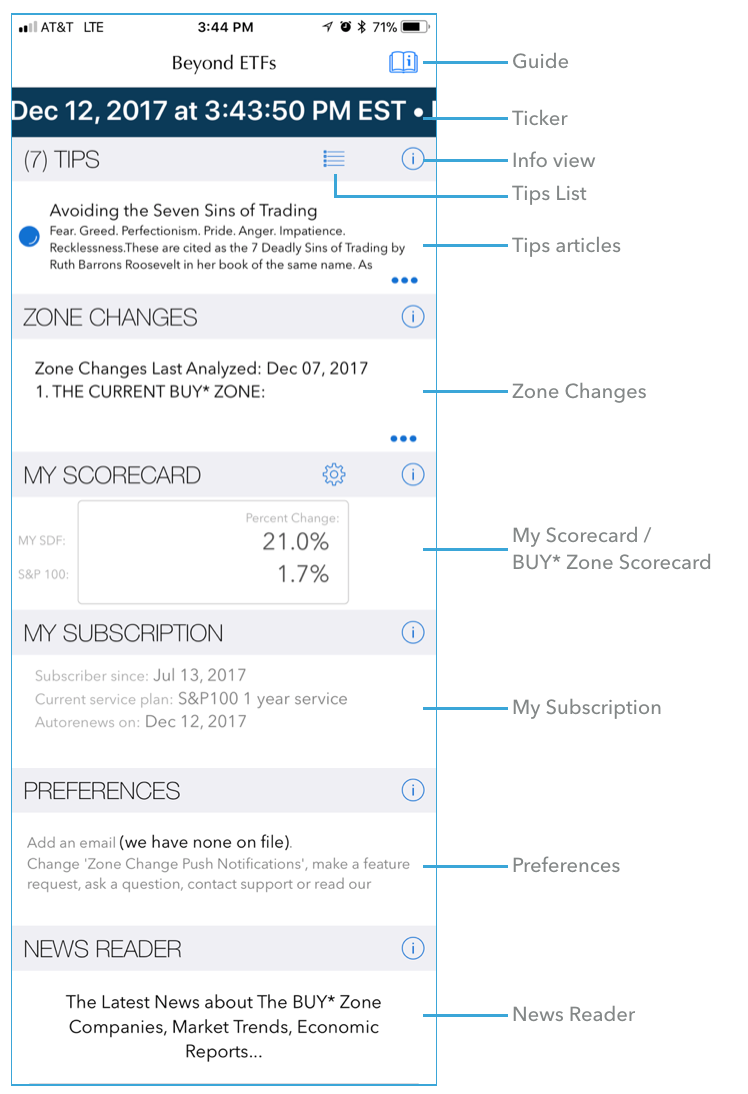
Guide – This section provides an introduction to the key improvements and features of the app. It is available on the dashboard and set in a handsome black background. Updates to the app routinely visit this feature only the first time.
Ticker – Using a real time financial information service, but refreshing approximately every 40 seconds or so, Beyond ETFs provides a scrolling view up to the minute results of the day’s price movements for the ten stocks of the BUY* Zone. Guest users have the symbols of the BUY* zone masked, but subscribers see the symbols. Declines are reported in a red color, while advances are white text.
Info view – these popups provide a short description of the goals of the section and how you might use it.
Tips – Encouraging anecdotes, thoughtful insights and answers to frequently asked questions are randomly presented in the Tips section. The (number) indicates the number of articles unread. The Tips List button presents a scrollable view of the entire library.
Zone Changes – This content is exclusively available for subscribers. The Brockmann Method is typically applied to the stocks of the Index daily. The changes in the BUY* Zone and DON’T BUY MORE zone are presented to subscribers, together with insights.
Buy Zone Scorecard / My Scorecard – This content is exclusively available for subscribers. Before adding one’s stock purchases into the Scorecard section, Beyond ETFs presents the Daily Change $, Proceeds (starts with $100,000 purchased at the first day’s previous day’s close), Annual Rate of Return and Percent Change comparing both the Model and the Index. Once the subscriber records their stock purchases, the app will change the title of this section to My Scorecard and tallies the score of your SDF versus the S&P 100 index.
Subscribe Now / My Subscription – Here are details about the state of your subscription if you’re a subscriber or tap to see the way to become a subscriber. ** Subscription includes 7 day FREE Trial.
ABOUT APPLE AUTO RENEW SUBSCRIPTIONS – Subscriptions automatically renew unless ‘auto-renew’ is turned off in iTunes account at least 24-hours before the end of the current subscription period. The payment method of your iTunes account will be charged the renewal fee 24 hours prior to the end of the current period at the price and frequency that you select above. Confirming the subscription will cause your iTunes account to be charged.
Preferences – change your email, push notifications settings, ask a question, make a feature request, submit a bug report, get support help, review our Privacy Policy and End User License Agreement.
News Reader – choose from over 100 different news feeds (RSS) including Barron’s, Wall Street Journal and Yahoo! Finance. This service is available to all users.
Coulda Calculator – the details of the Brockmann Method, applied since January 2007 are available for all to see. Tap on the graph to determine a date as if that was the date you started with the service. Actual experience may vary.
What’s Up – the stocks of the S&P100 are shown in each zone, with those that are owned bordered in white. For guests, the symbols and names of each stock are not available. Those that are up today are shown with a green edge, while those that are down on the day’s trading are shown with a red edge.
This post has already been read 0 times!
Edit